

.png)
For any general inquiries, please fill in the following contact form:
GET A QUOTE


Pico
PicoScope 5000E Series
Precision 16-bit USB Oscilloscopes

PicoScope 5000E Series - Our Precision Oscilloscopes
The PicoScope 5000E Series are the first four-channel oscilloscopes to offer 16-bit resolution with a low noise floor and high dynamic range to measure low-level signals.
16-bit Resolution With 16-bit resolution on each of its 4 channels, the PicoScope 5000E Series offers a high-performance ADC to capture low-amplitude signals, power supply ripple, distortion and other subtle millivolt transitions. This allows engineers to achieve high measurement precision for analog systems. |  |
Low Noise With a noise floor as low as 22 µV RMS, the PicoScope 5000E Series ensures even the smallest amplitude signals remain measurable and clear. When paired with 16-bit vertical resolution, the superior signal-to-noise ratio makes it an essential tool for high-precision signal analysis. |  |
High Dynamic Range Trust the data that you see with more than 73 dB of SFDR, exceptional crosstalk rejection and superior bandwidth flatness. This wide dynamic range means complex signals can be captured with precision. When paired with the powerful features of our PicoScope 7 software, it uncovers hidden signals with ease. | 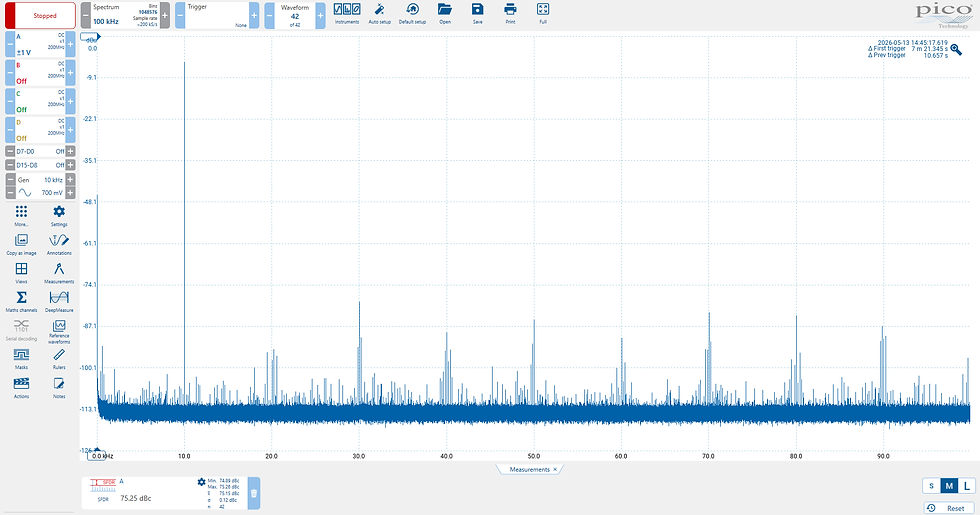 |
Unmatched Performance and Price Until now, engineers have been forced to choose between precision instruments too slow to capture transient events, or fast 8-bit scopes which lack the sensitivity to see microvolt-level changes. Now the PicoScope 5000E Series bridges this gap, combining lab-grade precision with high-speed digitizing and advanced triggering. For design engineers, it’s the only way to get world-class specs and deep memory at a reasonable price. |  |

PicoScope 9400A Series
Wideband (33 GHz) USB sampling scopes

PicoScope® 9300 Series
USB Sampling Oscilloscopes

PicoScope® 4262
16-bit high-resolution oscilloscope

PicoScope® 3000 Series
PC Oscilloscopes & Mixed Signal Oscilloscopes

PicoScope 3000E Series
500 MHz 5 GS/s digital USB oscilloscope

PicoScope® 6000 Series
Ultra-deep-memory, high-performance oscilloscopes and MSOs

PicoScope 4000A Series
High-resolution deep-memory oscilloscopes

PicoScope® 2000 Series
USB Oscilloscopes & Mixed Signal Oscilloscopes

PicoScope 9400 Series
5 & 16 GHz Oscilloscopes

PicoScope® 5000 Series
Flexible Resolution Oscilloscopes

PicoScope® 4444
High-resolution differential USB oscilloscope
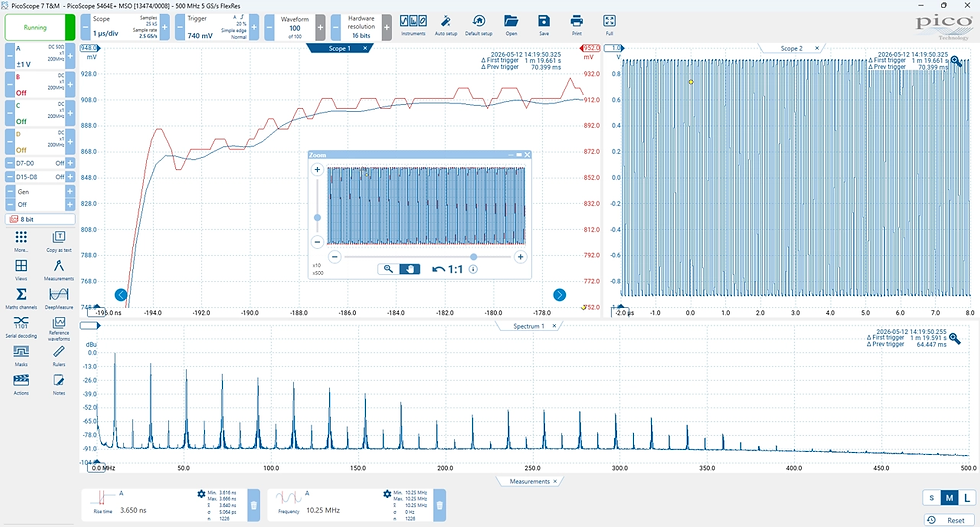 |  |
FlexRes® Technology For applications that demand precision or speed, the PicoScope 5000E Plus features switchable 16-bit or 8-bit resolution. 16-bit mode increases vertical precision for detailed voltage readings. 8-bit mode boosts bandwidth and sampling rates to capture fast edges and digital signals without aliasing. | Higher Sample Rate In 8-bit mode, the PicoScope 5000E Plus increases the sampling rate to 5 GS/s, enabling precise timing verification. Capture high-speed digital signals with a resolution as low as 200 ps and analyze them with the powerful PicoScope 7 software. |
 | 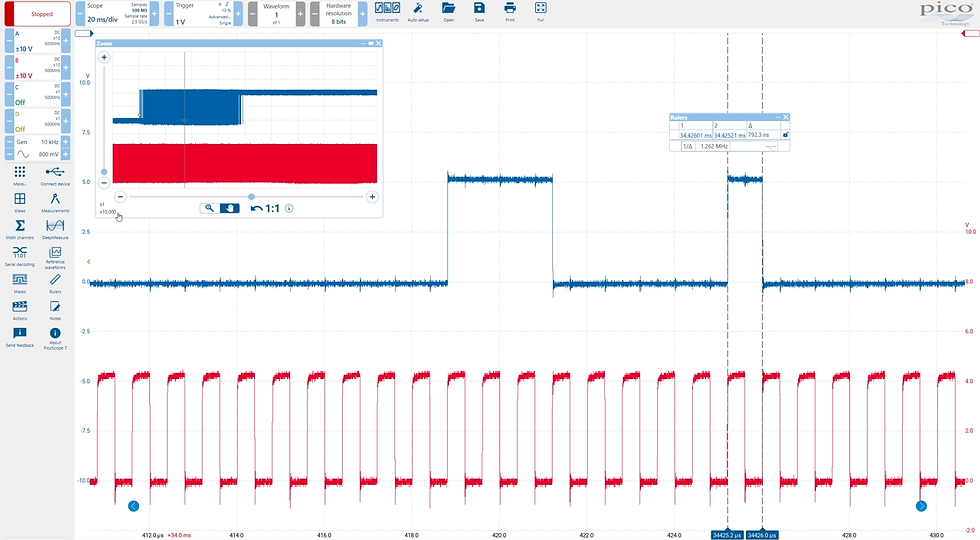 |
Bandwidth up to 500 MHz PicoScope 5000E Plus models feature up to 500 MHz bandwidth in 8-bit mode. This accurately captures fast digital edges and high-frequency switching transients, resolving fast waveform details like ringing and overshoot that slower scopes miss. | Deeper Memory The 8-bit mode on the PicoScope 5000E Plus doubles the memory to 2 GS, so you can capture long data packets with high time resolution. Memory segmentation provides multi-capture waveform analysis for in-depth mask limit testing, waveform averaging and persistence testing. |
Hardware features
Unmatched Hardware Performance
The PicoScope 5000E Series are the world's first 4-channel 16-bit USB oscilloscope and MSOs
 |  |
The High-Resolution Advantage Compared to a standard 8-bit scope, our native 16-bit hardware delivers 256 times more vertical detail. This allows you to visualize minute ripple, noise, and distortion even when signals are superimposed on larger DC voltages. All data processing (including math channels and filtering) is maintained at a minimum of 16-bit resolution, ensuring that when you zoom in on low-level signals, you are seeing real data rather than quantization noise or digital artifacts. | Deep Memory and Sustained Performance High sampling rates for sustained periods of time need large sample memory. The Picoscope 5000E Plus models solve this with a massive 2 GS capture memory. This allows the device to maintain its maximum 5 GS/s sampling rate for a full 200 ms duration. Whether you are capturing a second-long power-up sequence or searching for a single high-speed transient buried in a long data stream, the 5000E Series provides nanosecond time resolution without forcing you to compromise on your capture window or vertical accuracy. |
Precision Engineering and Hardware Scalability
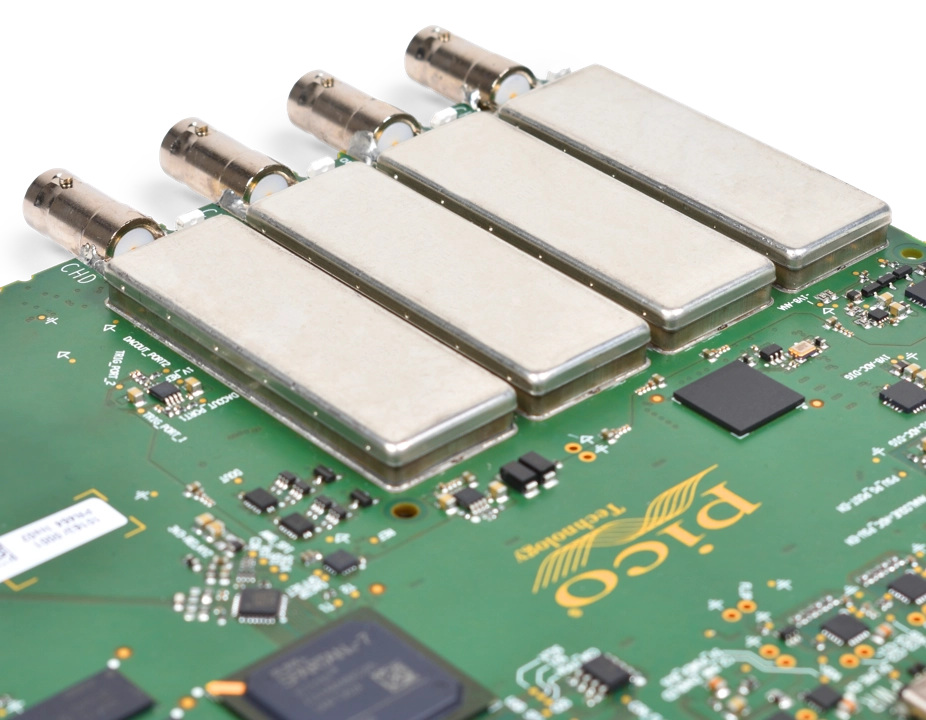 | 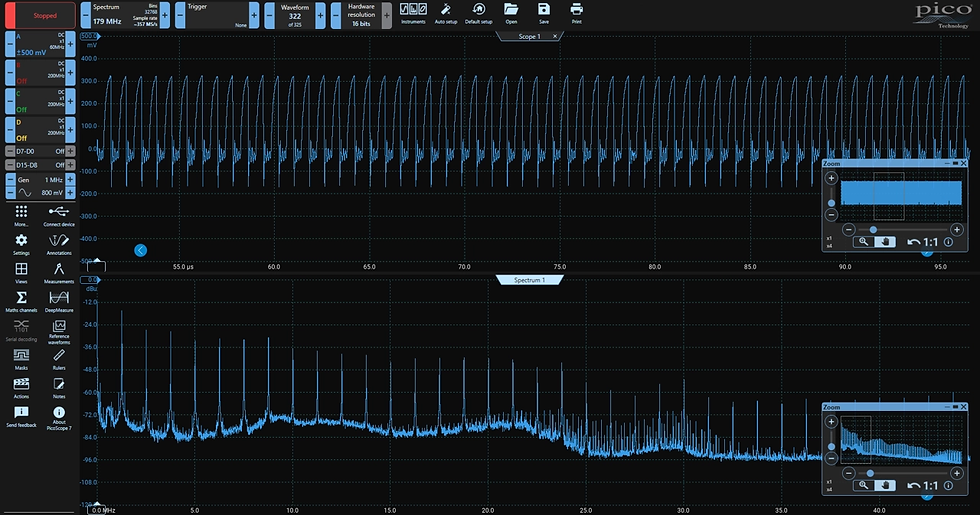 |
Signal Integrity and Front-End Engineering Precision starts at the probe tip. The 5000E Series features a meticulous front-end design with shielded inputs to eliminate crosstalk and harmonic distortion. With a noise floor as low as 22 μV RMS and a typical channel-to-channel isolation ratio better than 500:1, you can detect microvolt-level signals that are typically lost in the noise floor of lesser instruments. This exceptional signal integrity is backed by improved bandwidth flatness and a 73 dBc SFDR, making it the ideal tool for stabilizing precision power rails or analyzing sensitive sensor data. | Bandwidth and Memory Scalability The PicoScope 5000E Plus models feature a flexible hardware architecture that allows you to prioritize precision where you need it or speed when it matters. While the series supports up to 16-bit resolution for low-noise analog analysis, you can switch to 8-bit mode to unlock the scope's full speed. In 8-bit mode, the sampling rate doubles to 5 GS/s, and the capture memory expands to a massive 2 GS. This configuration is ideal for capturing high-speed serial buses and signals with edges up to 500 MHz. |
Software features
Ultra-High-Definition Display

Utilise the full high-definition display of the host PC to display the full 16-bit resolution. PicoScope PC-based oscilloscopes use the host computer’s display, which is typically larger and of higher resolution than the dedicated displays installed in traditional benchtop scopes. This allows for simultaneous display of time- and frequency-domain waveforms, decoded serial bus tables, measurement results with statistics and more.
Large, high-resolution displays make it easy to view the high-resolution signals achieved with the PicoScope 5000E Series. With a 4K monitor, PicoScope can display more than ten times the information of traditional benchtop oscilloscope displays
High Precision Analog Analysis Tools
 |  |
Persistence Mode Utilise the PicoScope 7 persistence mode to see new and old waveforms superimposed, making it easy to spot glitches and dropouts to estimate their relative frequency. This mode is useful for displaying and interpreting complex analog signals, such as video waveforms and amplitude modulated signals. Color-coding and intensity-grading demonstrate which areas are stable and intermittent. The PicoScope 5000E Series’ HAL4 hardware acceleration can achieve continuous update rates of 300 000 waveforms per second in fast persistence mode. The high waveform update rate provides better visual insight into signal behavior and dramatically increases the probability that the oscilloscope will quickly capture transient anomalies, such as jitter, runt pulses and glitches. | Power Measurements Make high precision 16-bit power supply measurements with the PicoScope 7 suite of power measurements and associated power math channels including: •True Power •Apparent Power •Reactive Power •Power Factor •DC Power •Crest Factor •Area at AC • +Area at AC • -Area at AC • Abs area at AC • Area at DC • +Area at AC • -Area at AC • Abs area at DC • Phase Unlike many other oscilloscopes, all these measurements are included as standard without costly add-ons. |
Triggering
Many digital oscilloscopes still use a trigger architecture based on analog comparators. This causes time and amplitude errors that cannot always be calibrated out and often limits the trigger sensitivity at high bandwidths. In 1991 Pico pioneered the use of fully digital triggering using the actual digitized data. This technique reduces trigger errors and allows our oscilloscopes to trigger on the smallest signals, even at the full bandwidth. Trigger levels and hysteresis can be set with high precision and resolution.

The PicoScope 5000E Series offers a set of advanced trigger types including pulse width, runt pulse, windowed, rise/ fall time, logic and dropout that function across the full scope bandwidth.
The digital trigger available on MSO models allows you to trigger the scope when any or all of the 16 digital inputs match a user-defined pattern. You can specify a condition for each channel individually, or set up a pattern for all channels at once using a hexadecimal or binary value.
The logic trigger function also allows you to trigger on combinations of edge or window triggers on any of the analog inputs, for example to trigger edges on channel A only when channel B is also high, or to trigger when any of the four channels goes outside a specified voltage range.
The Oscilloscope for Math and Measurements
Measurements: Introduction
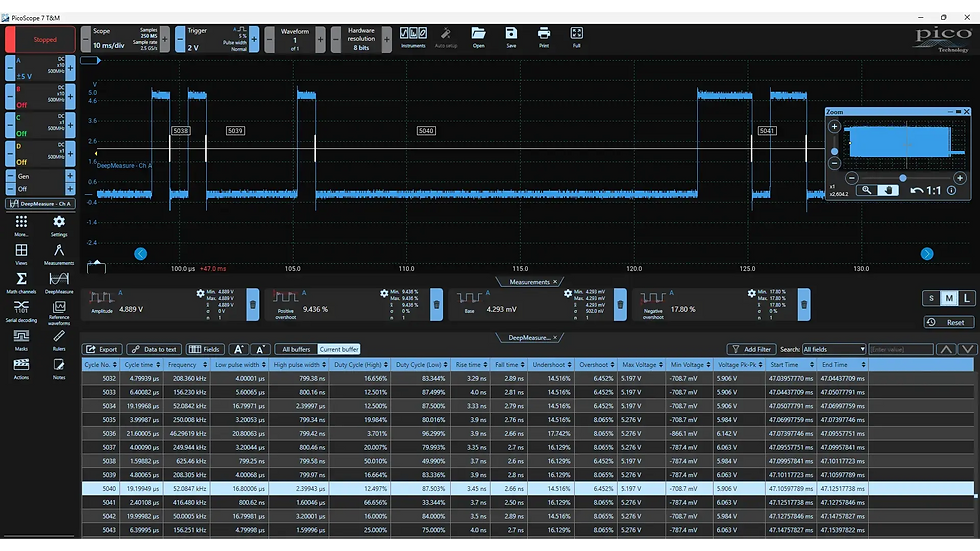
PicoScope 7 provides dozens of automated measurements both for the oscilloscope and spectrum; not just the standard ones like DC level and frequency, but more complex ones such as overshoot, edge count, phase, power factor, THD and SINAD. Statistics can be displayed to show the Average, Mean, Maximum, Minimum, Standard Deviation and a count of the number of waveforms. Measurements are highly configurable allowing you to measure across the whole waveform, between rulers or just a single cycle.
Measurements: Pass/Failure Limits
PicoScope software offers pass/failure limits for any measurement. This gives a visual indication within the measurement window whenever the measurement result goes above or below a specified value. Pass/failure limits can be combined with actions to immediately alert the user or execute other actions when a measurement threshold has been exceeded, either above or below set limits. By filtering the waveform buffer to show only those waveforms failing a measurement limit, you can quickly identify points of interest out of the thousands of waveforms captured in the deep memory of your PicoScope.

DeepMeasureTM - One Waveform, Millions of Measurements
The measurement of waveform pulses and cycles is key to verifying the performance of electrical and electronic devices.
DeepMeasure delivers automatic measurements of important waveform parameters, such as pulse width, rise time and voltage, for every individual cycle in the captured waveforms. Up to a million cycles can be displayed with each triggered acquisition or combined across multiple acquisitions. Results can be easily sorted, analyzed and correlated with the waveform display, or exported as a .CSV file or spreadsheet for further analysis.
For example, use DeepMeasure with PicoScope’s rapid trigger mode to capture 40 000 pulses and quickly find those with the largest or smallest amplitude, or use your scope’s deep memory to record a million cycles of one waveform and export the rise time of every single edge for statistical analysis.

Math Channel and Filters
Math channels add additional traces to your waveform. You can select simple functions such as addition and inversion with a click, or you can use the equation editor to take things to the next level and create functions involving math, trigonometry, exponentials, logarithms, statistics, integrals and derivatives.
Math channels also provide multiple filter options (lowpass, highpass, bandpass and bandstop) to allow for example both the raw view of a signal and one with a lowpass filter added to be viewed at the same time.
Many measurement functions are available as math channels which combined with deep memory captures reveal new details about your signal - you can plot changing frequency, duty cycle or phase as extra channels alongside the originals.
Display up to eight real or calculated channels in each scope view. If you run out of space, just open another scope view and add more.
FFT Spectrum Analyzer
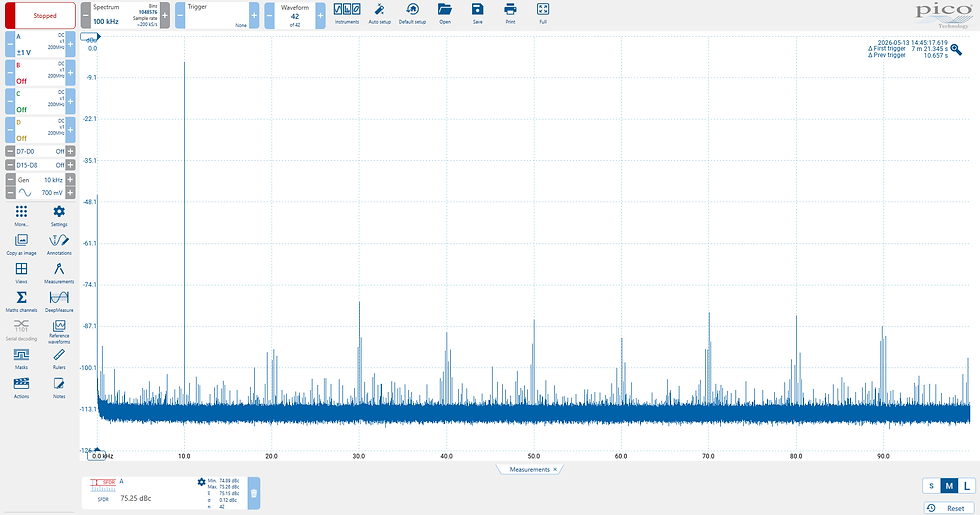 |  |
The integrated FFT spectrum analyzer provides detailed frequency domain analysis, ideal for identifying noise, crosstalk and signal distortion. The spectrum analyzer in PicoScope is of the Fast Fourier Transform (FFT) type which, unlike a traditional swept spectrum analyzer, can display the spectrum of a single, non-repeating waveform. With up to a million points and comprehensive measurement tools, PicoScope's spectrum analysis capabilities are second to none. With a click of a button, you can display a spectrum plot of the active channels, with a maximum frequency up to the bandwidth of your scope. To focus on a specific frequency range you can directly set the start and stop values of the analyzer frequency axis. You can display multiple spectrum views alongside oscilloscope views of the same data. A comprehensive set of automatic frequency-domain measurements can be added to the display, including THD, THD+N, SNR, SINAD and IMD. You can even use the AWG and spectrum mode together to perform swept scalar network analysis. | The spectrum works with the waveform buffer so you can capture and rewind through thousands of spectrum plots - or why not use the mask limit tests to scan through them all automatically? Spectrum masks can also work with PicoScope actions so you can leave the spectrum running continuously and choose to save mask fails to disk or even sound an audible alarm.
FFT Spectrum Settings
A full range of settings gives you control over the number of spectrum bands (FFT bins), scaling (including log/log) and display modes (instantaneous, average or peak-hold). A selection of window functions allows you to optimize for selectivity, accuracy or dynamic range. |
Masks

Mask limit testing allows you to compare live signals against known good signals, and is designed for production and debugging environments. Simply capture a
known good signal and use it to auto-generate a mask and then measure the system under test. PicoScope will check for mask violations and perform pass/fail testing,
capture intermittent glitches and can show a failure count and other statistics in the Measurements window. Masks can be saved in a library for future use, and exported/
imported to share with other PicoScope users.
Actions and Alarms

PicoScope can be programmed to execute actions when certain events occur. Events that can trigger an action include measurement and mask limit failures, trigger events and buffers full. The actions that PicoScope can execute include:
Stop the capture
Save waveform to disk in your choice of format including .csv, .png and .matlab
Play a sound
Trigger signal generator or AWG
Run an external application or script
Export serial-decoded data to a file on disk
Actions, coupled with mask limit testing, help create a powerful and time-saving waveform monitoring tool. Capture a known good signal, auto-generate a mask around it and then use the actions to automatically save any waveform (complete with a time/date stamp) that does not meet specification.
The Oscilloscope for Serial Decoding

Experience unparalleled serial data analysis with PicoScope USB oscilloscope software, now featuring the capability to decode 40 different protocols, including 10BASE-T1S, 1-Wire, I2C, SPI, UART, CAN, and many more (see the image for full details). The PicoScope 5000E Series, with its deep memory and high sampling rates, is perfect for complex serial data analysis, enabling simultaneous decoding of multiple protocols.
On MSO models both the analog and digital channels can be used to decode up to 20 channels of serial data, giving you the flexibility to decode multiple buses simultaneously.
Key features:
Comprehensive protocol support: Decode multiple different protocols currently using all the channels of your oscilloscope, providing extensive versatility for complex applications.
High-resolution data visualization: View decoded data in hex, binary, decimal, or ASCII directly beneath the waveform on a common time axis. Error frames are highlighted in red for quick identification and can be zoomed in for a detailed investigation of noise or signal integrity issues.
Detailed table format: See a comprehensive list of decoded frames, including all data, flags, and identifiers. Use filtering to focus on specific frames or search for frames with particular properties. The statistics option gives deeper insight into the physical layer, revealing frame times and voltage levels. Click any frame in the table to zoom into its corresponding waveform.
Export and offline analysis: Easily export table view data for offline viewing and analysis, ensuring you can work with your data whenever and wherever you need.
Link file feature: Accelerate your analysis by cross-referencing values to human-readable text.
Discover why PicoScope is the preferred choice for professionals demanding precision and efficiency in serial decoding.
DATASHEET